- Wamaitha's Newsletter
- Posts
- Deriv Boom 1000 Index Frustrations + Free trading bots
Deriv Boom 1000 Index Frustrations + Free trading bots
Spike detector or money loser?
Howdy!
Look at the image below. What do you see?

The green are spikes
You can see two different strategies from this chart.
We can either “catch “ the spike(green) or “ride the wave” (red candles after the spike)
If you ride the wave, you would be selling on the Boom 1000 Index and if you catch the spikes you would buy.
The main challenge about spikes is that we never know when they will form.
To quote Deriv:

So how are we supposed to beat an algorithm that is pegged to nothing within the real world?
Do technical indicators even work?
Does the algorithm ‘think’ about support and resistance?
Does the algorithm change based on the current market supply and demand?
I attempted to answer the first question. Do technical indicators even work?
I used 5 different technical instruments in an attempt to make a profitable strategy.
The 5 being:
Kaufman Adaptive Moving Average (AMA).
Commodity Channel Index (CCI).
Relative Strength Index(RSI).
Stochastic Oscillator indicator.
Support and resistance from a higher timeframe.
Something interesting happened when I used the AMA alone. The strategy was as follows:
When the price of the currently forming candle closes above the AMA, we get into a BUY, anticipating a Spike.
When the price closes below the AMA, we get into a sell position to ride the wave.
And the backtest graph looked like this:
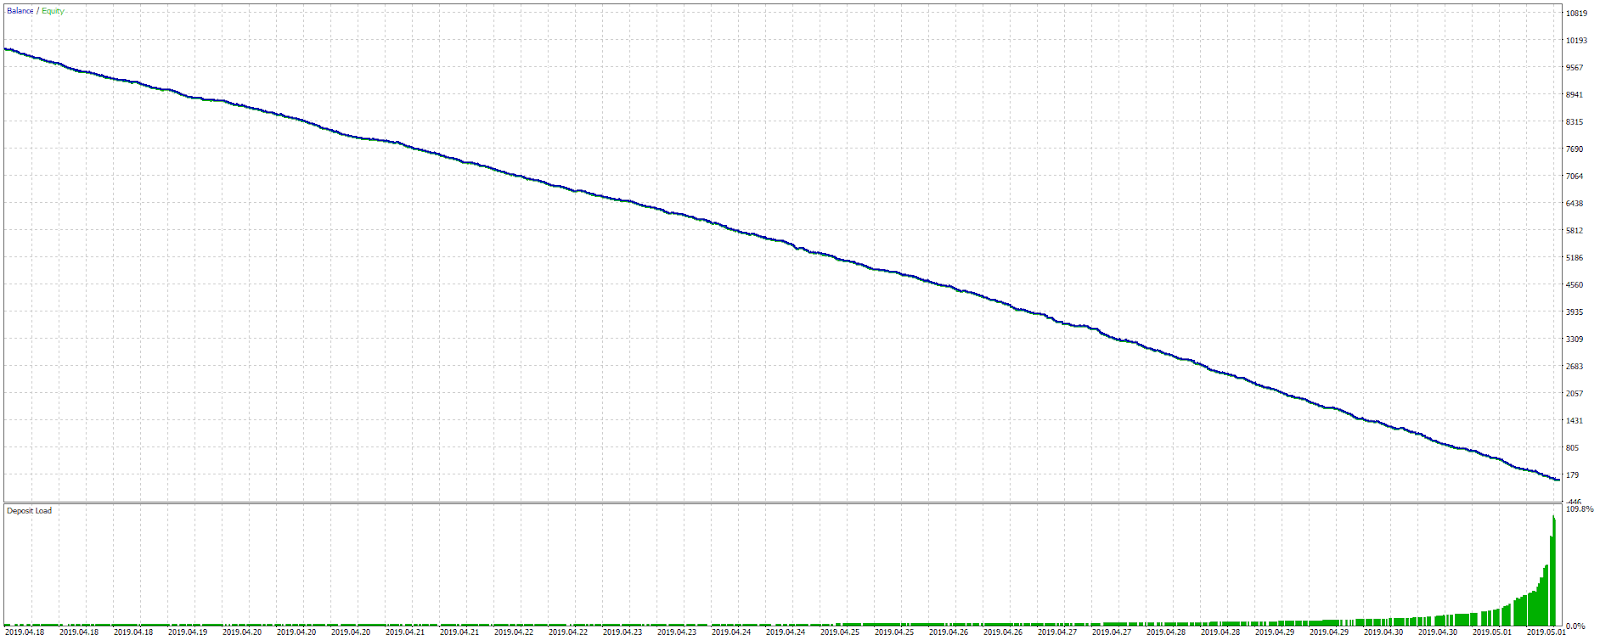
Straight up lost money for the entirety of the strategy.
I went back to the drawing board and arrived at the following:
Wait for 10 consecutively falling AMA values,
Make sure the 10th is below the AMA at that point
Make sure the CIC is below negative 100
The RSi is below 30
The Stochastic is below 20
And the current price is below the resistance level

The backtest results using this 5 looked like this:
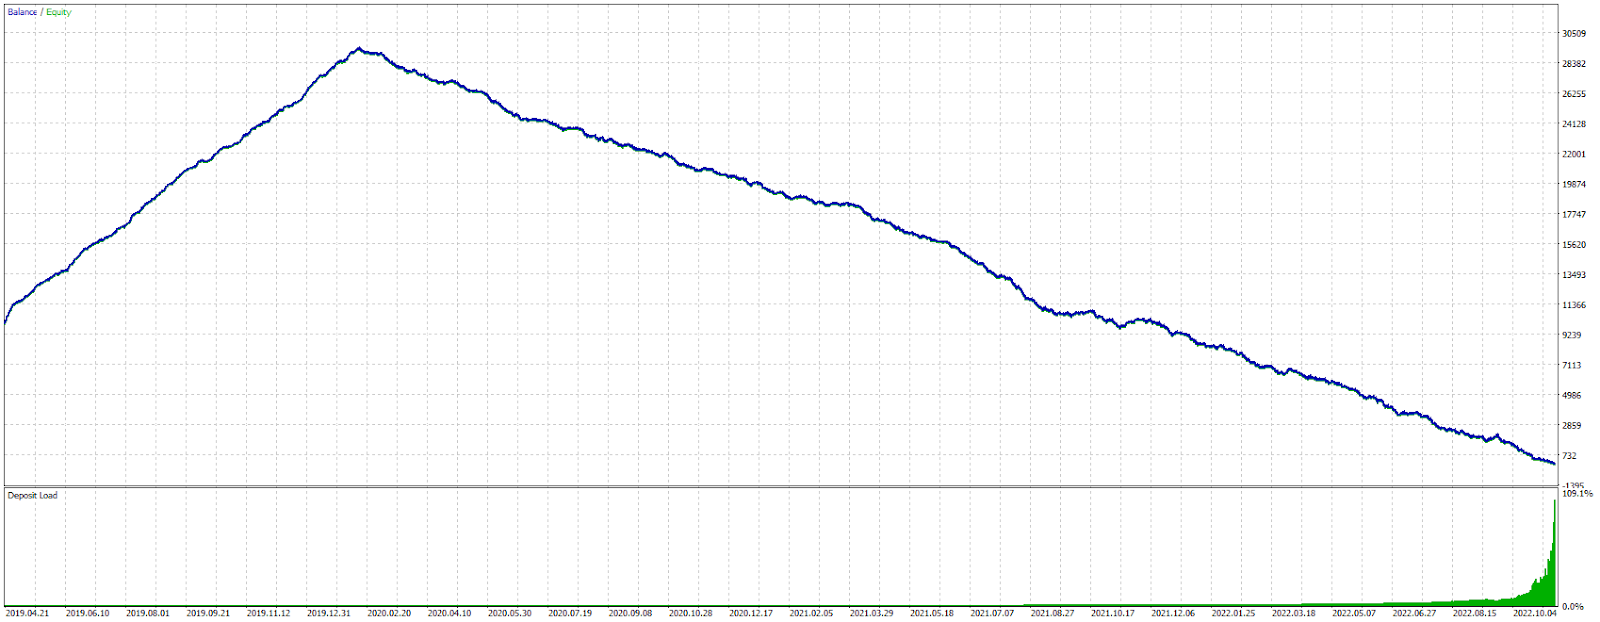
backtest graph
The graph above shows the profit the strategy generated. It starts off being so profitable then a sharp dip happens.
On further investigation, the dip happens on February 18th 2020.
When you scroll on the Boom 1000 Index chart to this date, something interesting comes up.
We don’t have one but two “gaps”. The gaps look like this:
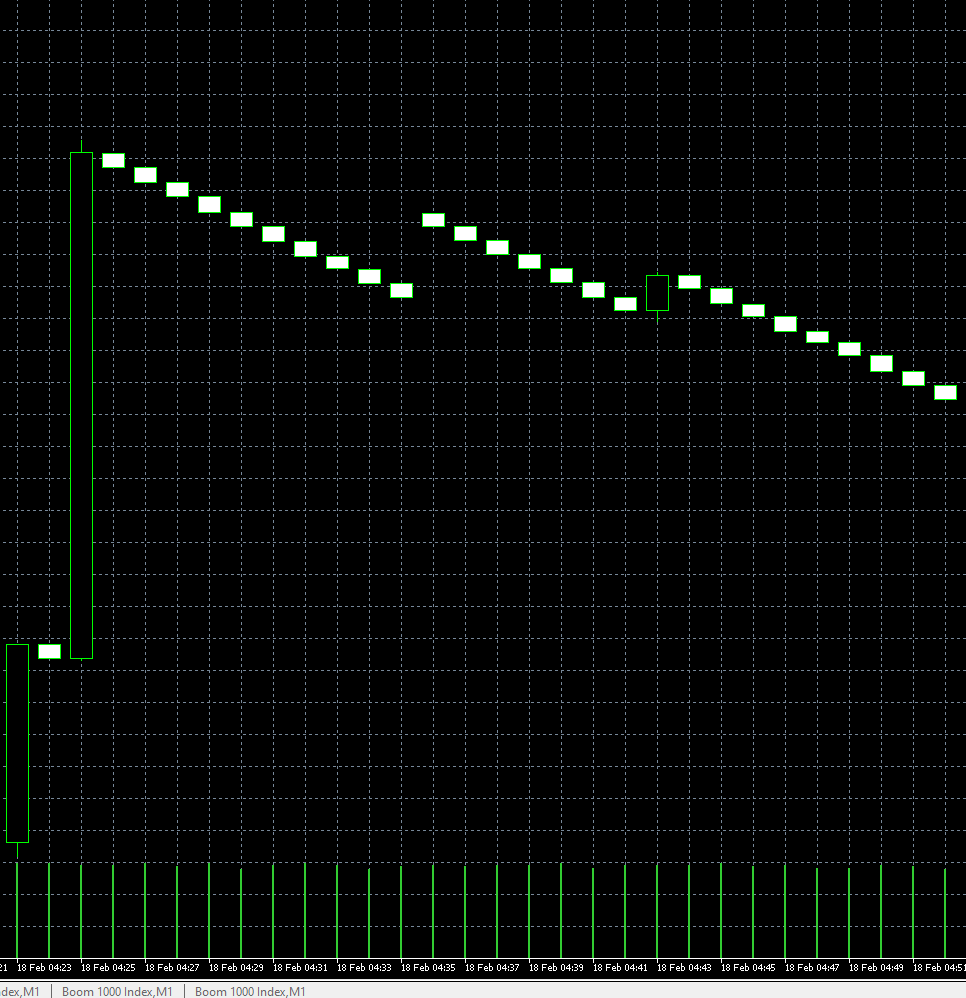
First gap
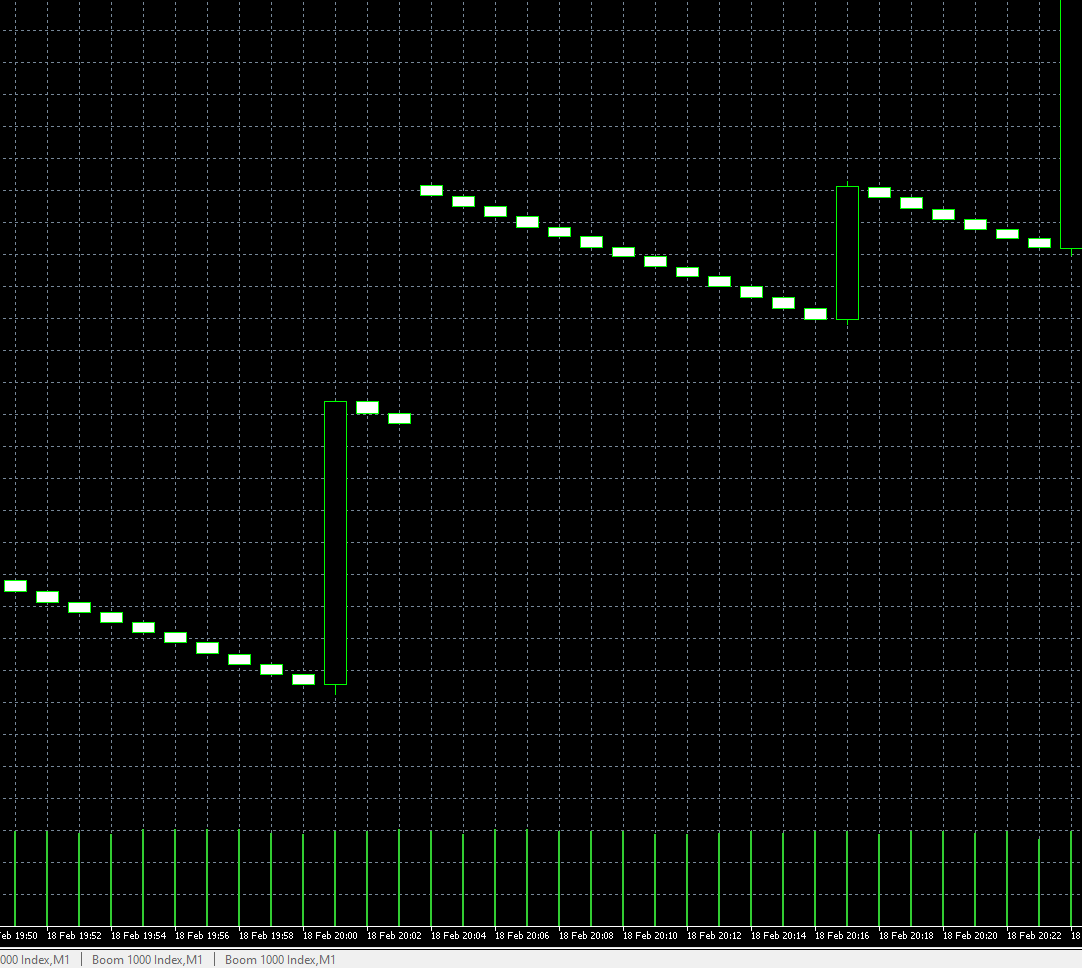
Second gap
You can tell the gaps are not Spikes. I reached out to the deriv support and they confirmed the gaps happen on an algorithm change.
This experiment does not exhaustively rule out technical analysis but it makes me wonder if we can actually use technical analysis to make money on Deriv.
I want to combine more indicators and see where that leads.
You can test out the bots on other assets and let me know if any comes up profitable.
Download the bots from here
Reply